
As 2020 winds down and we reflect on this unprecedented year, it’s amazing to see how the Denver Metro market fared. Whether it’s active listings or percent sold to list price, 2020 was clearly the outlier and our market was more ambitious than we’ve ever seen it. Thinking back to March and April’s market slow down and then the boom that hit in May – we are so thankful to have had the support of you and the entire Colorado real estate community through the (literal) ups and downs of this past year. Thank you for your continued patience and perseverance. We are excited to see what this new year brings!
Supply – Active Listings
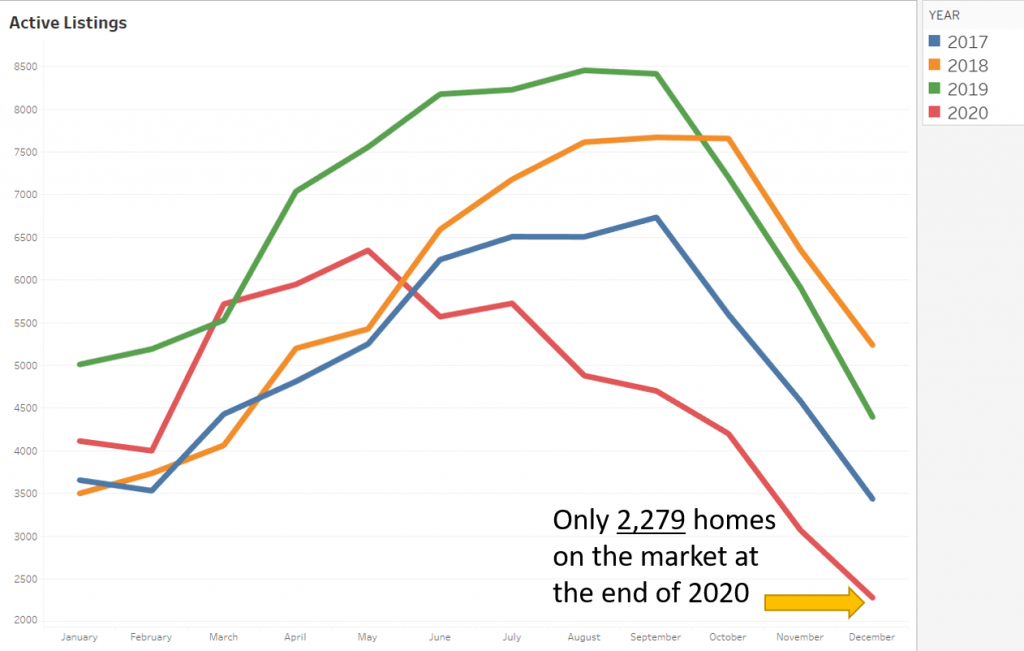
The year started with active inventory at 4,114 homes, a similar level to the last three years. Typically, supply (active listings) continues to increase until peaking between August and September, but not this year. This year active listings peaked in May with 6,347 and ended the year at an all time low for December with 2,279 homes on the market down 48% Year-Over-Year (YoY). Compared to 2019, when inventory peaked in August with 8,455 active listings for sale, 2020 was truly a unique year. COVID-19 suppressed inventory in Greater Metro Denver with many homeowners not wanting to place their homes on the market amid a pandemic and extremely strong buyer demand.
- 2,279 Active Listings – Down 48% YoY
New Listings
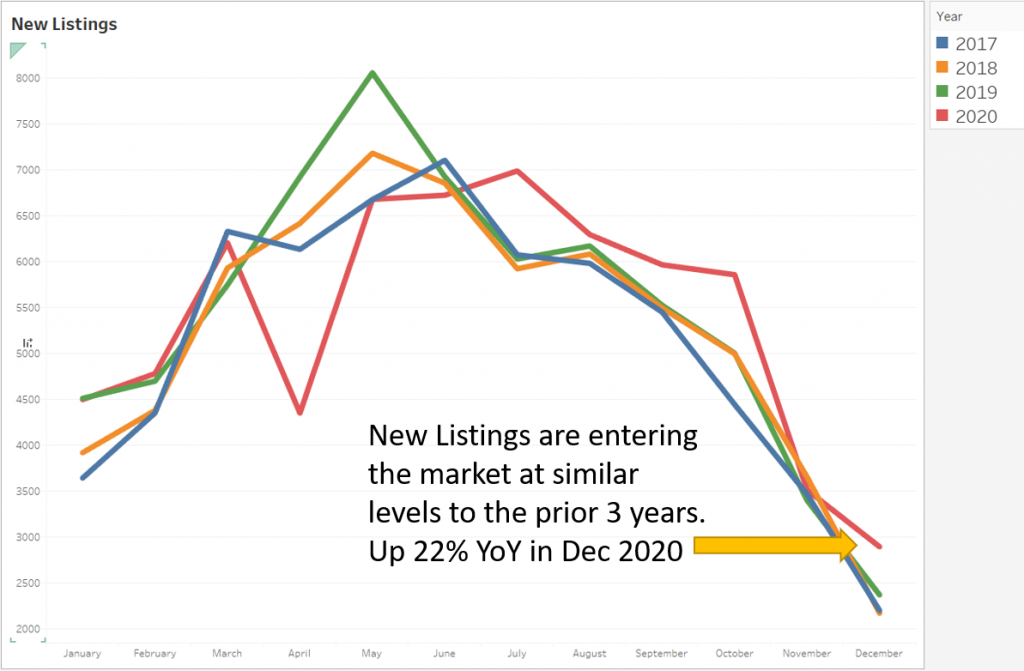
New listings are coming on the market at a pace very similar to the last 3 years with December 2020 showing a strong increase in new listings, up 22% year-over-year (YoY). New listings are coming on the market, they are just being moved to pending at record-speeds.
- 2,895 New Listings – Up 22% YoY
Demand – Pending Sales
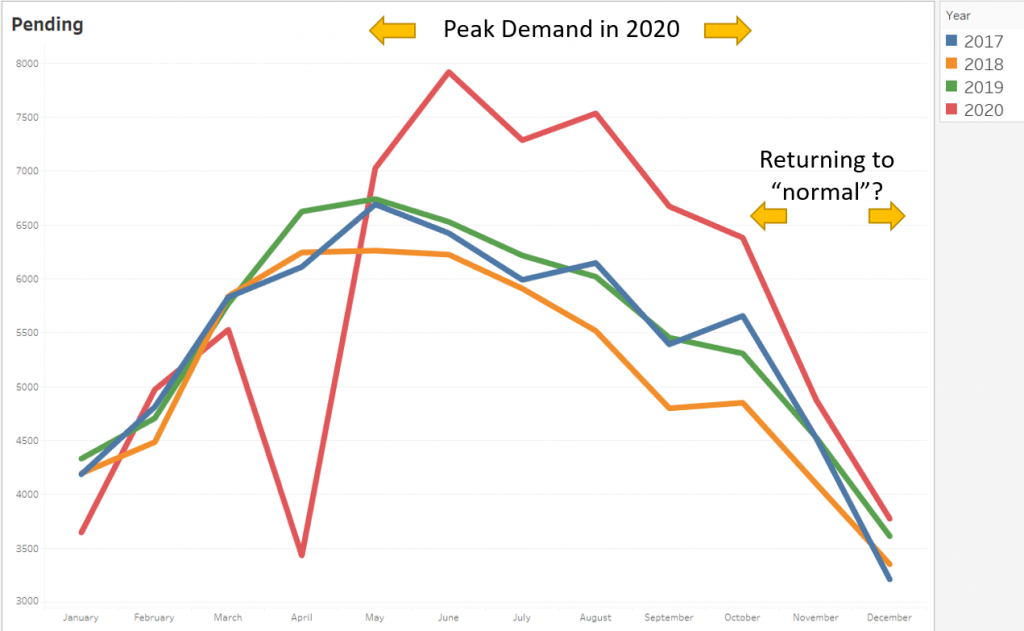
Demand spiked in June of this year after the historic drop-off in April due to the COVID-19 Stay-at-Home order and continued to be well above prior years through October. We started to see a return to “normal” levels of demand near the end of the year with December pending sales at 3,775 up 5% year-over-year (YoY).
Percent of Closed to List Price
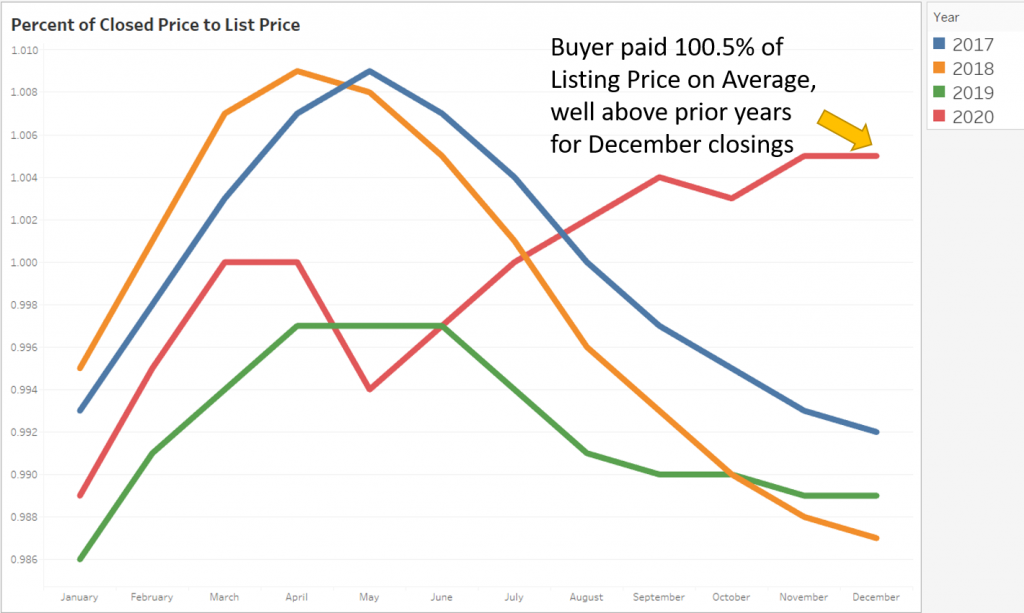
Increased demand and low supply are driving the increase in the percent of closed to list price. Traditionally we see this metric start to decrease in July and continue to drop through the rest of the year. As you can see from the graph below, that is hardly the case this year. On average, buyers paid 100.5% of the list price in November vs buyers paying 98.8% of list price during November of 2019. It is still a very competitive market for buyers to be in.
Sold Price Summary
- Single Family Average $605,642 – Up 17% YoY
- Single Family Median $500,000 – Up 13% YoY
- Condo/Townhome/Multi Average $386,835 – Up 4% YoY
- Condo/Townhome/Multi Median $330,000 – Up 8% YoY
Source: J. Renshaw / Land Title Guarantee Company