

DECEMBER 2020
With average days in MLS at 21 days and month supply of inventory at 0.6 months, the Denver housing market in November is just as hot as any spring markets during the last 3 years.
Sold Price Summary
- Single Family Average $608,182 – Up 16% YoY
- Single Family Median $507,250 – Up 14% YoY
- Condo/Townhome/Multi Average $387,003 – Up 7% YoY
- Condo/Townhome/Multi Median $335,000 – Up 8% YoY
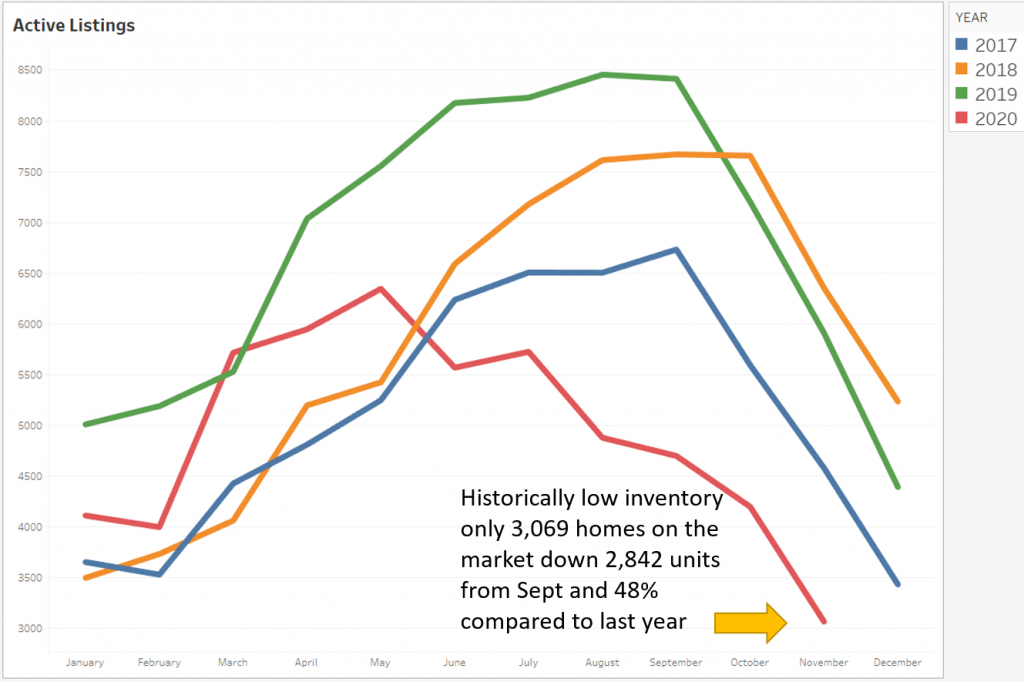
Supply – Active Listings
The active listing inventory dropped by 2,203 homes in the last month, down 48% year-over-year to 3,069 active listings. This is the lowest level since tracking began in 2010.The scarce active listings is unpresented and surely not over yet – expect inventory to continue to drop as the year comes to an end. The typical seasonal decline is due to both weather and the busy holiday season, luring sellers to wait a few months for the spring market. Hold on tight, because this low inventory is going to set the stage for a very competitive spring market.
- 3,069 Active Listings – Down 48% YoY
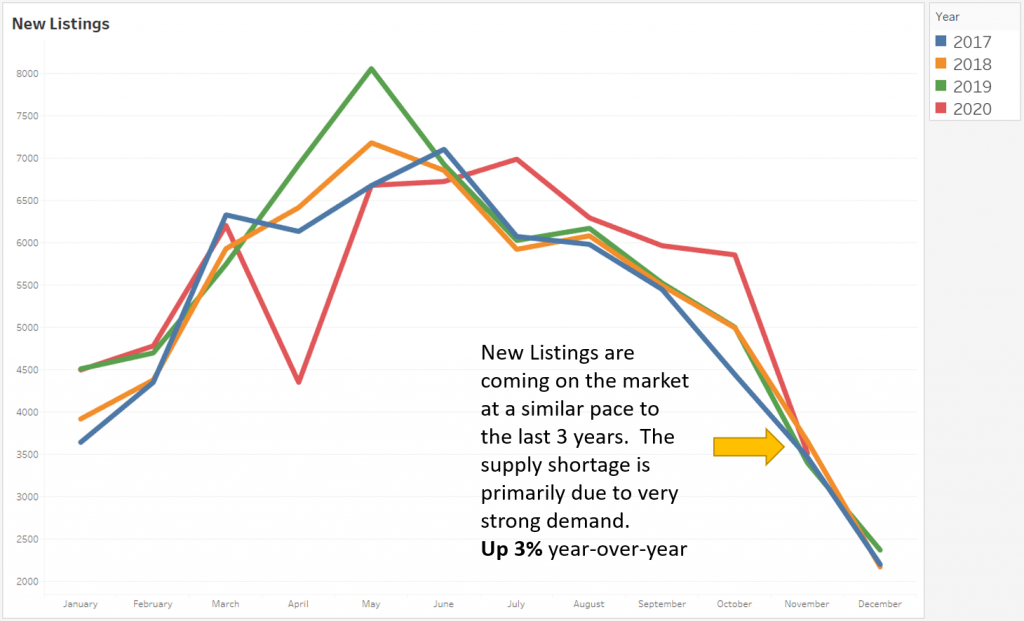
New Listings
New listings are coming on the market at a pace very similar to the last 3 years. Here’s a snapshot: 3,400 listings in November 2019, 3,654 listings in November 2018, and 3,654 listings in November 2017. At the risk of sounding like a broken record, this is where it all comes back to demand. New listings are coming on the MLS, they are just being moved to pending at record-speeds.
- 3,514 New Listings – Up 3% YoY
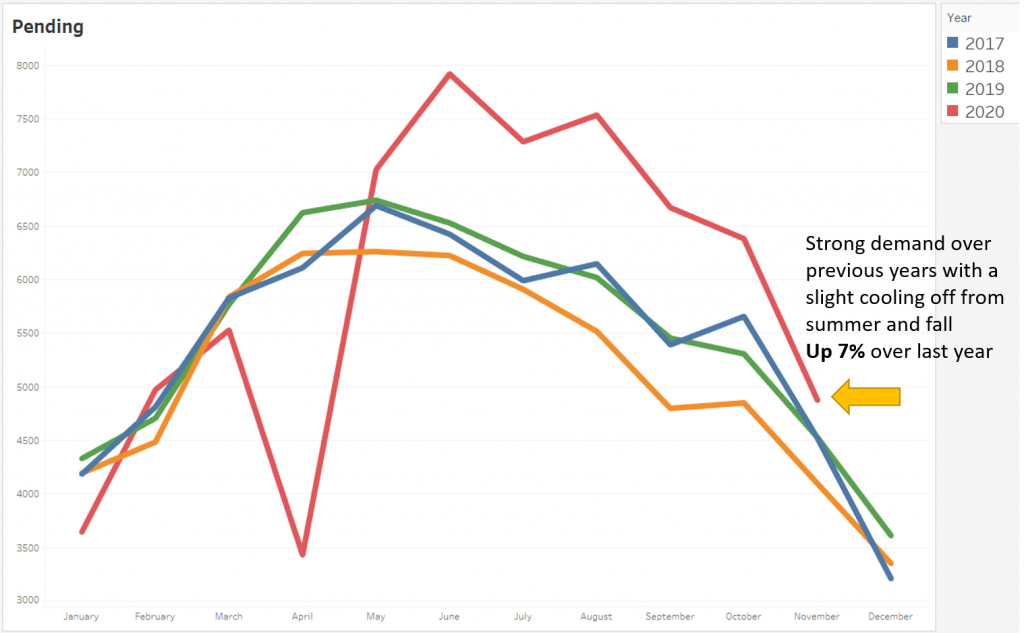
Demand – Pending Sales
Although we are seeing slight cooling in November from its peak in June, the market is still experiencing strong demand, up 7% compared last year. Pending sales took a big hit in April, rebounded and now year-to-date pending sales are up 5% year-over-year. Strong demand has been a big factor in creating the supply shortage with each of the last 6 months of 2020 outpacing the same 6-month-period of 2019.
- 4,876 Pending – Up 7% YoY
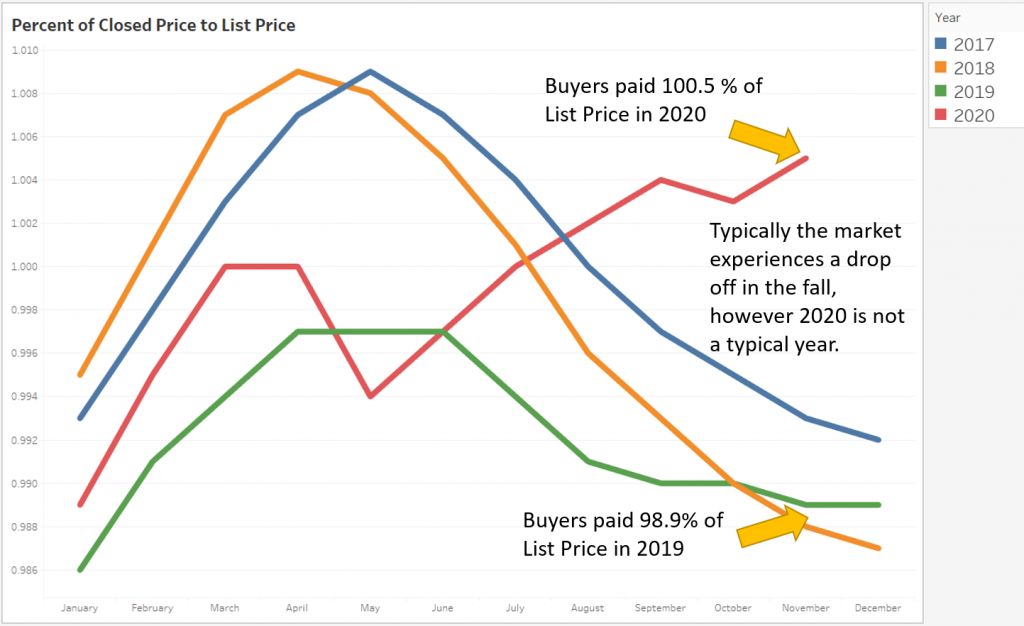
Percent of Closed to List Price
Increased demand and low supply are driving the increase in the percent of closed to list price. Traditionally we see this metric start to decrease in July and continue to drop through the rest of the year. As you can see from the graph below, that is hardly the case this year. On average, buyers paid 100.5% of the list price in November vs buyers paying 98.8% of list price during November of 2019. It is still a very competitive market for buyers to be in.
Source: J. Renshaw/Land Title Guarantee Company